Feeling on awakening
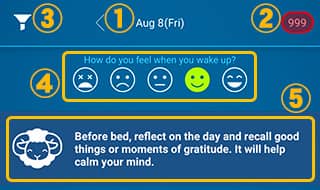
① Date
This is the date when you stopped tracking your sleep. If there're two or more logs on the same date, the digit that indicates order will be shown on the right side of the date.
② Analysis button
By tapping the button at the top right of the screen, an analysis screen will be shown. The digit means the latest amount of Sleep Debt (min). When the app can't calculate Sleep Debt, "??" will be shown instead of the digit.
③ Notes filter【Premium】
This filter feature is used to find sleep logs that have notes added. Tap this button to open the list and select a note to activate the filter. With the filter is enabled, only sleep logs with the selected notes added are displayed on the record screen.
Tap the filter button again to disable the filter.
④ Feeling on awakening (Face icons)
You can add your feeling when you woke up by tapping on the icon.
⑤ Sleep Tips
After finishing recording, enter how you woke up (④) and a "Sleep Tip" will be displayed based on your entered Feeling on awakening and your actual sleep record.
"Sleep Tips" contain a variety of information, such as advice and points to keep in mind for getting a good night's sleep, and can help you improve your sleep.
* "Sleep Tips" are only displayed on the most recent Record Screen.
Results: Sleep
Here is the brief results of your sleep. Tap “Details” to view more information about your sleep.
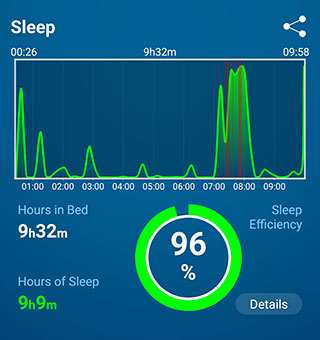
Sensor Graph
The sensor detects your body movements during your sleep. The detected data will be shown on the graph. The red band in the graph indicates the range of your awakenings judged by the app. There is nothing to do with your consciousness.
Hours in Bed
JUKUSUI defines the time when you started the log as "Bedtime" and the time when you ended the log as "Wake-up Time". “Hours in Bed” is the length of time from you went to bed until you woke up.
Hours of Sleep
This is the length of time obtained by subtracting the sleep onset latency and the hours of wakefulness (total hours in the red band in the graph) from the hours in bed. In this app, “hours of sleep” represents the length of time when the app determines that you were actually sleeping.
Sleep Efficiency
This shows the proportion of “Hours of Sleep” to “Hours in Bed”. Generally, the older we get, the lower our sleep efficiency tends to be. A frame of reference as follows:
・Age 20:92%
・Age 30:91%
・Age 40:89%
・Age 50:87%
・Age 60:85%
Sleep Details
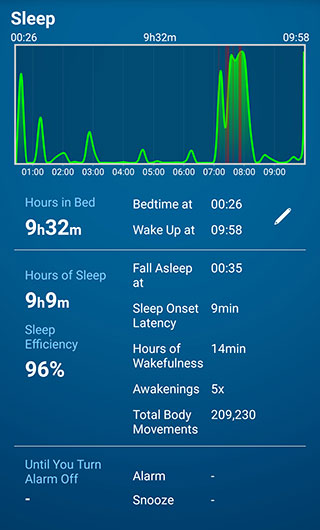
Hours in Bed
This is the length of time from when you go to bed (start the log) until you wake up (end the log).
Bedtime/Wake-up Time
This is the time to went to bed (start the log) and the time you woke up (end the log). Tap the pencil icon to change the time.
Hours of Sleep
This is the length of time obtained by subtracting the sleep onset latency and the hours of wakefulness from the hours in bed.
Sleep Efficiency
Sleep Efficiency is the proportion of hours of sleep to the hours in bed.
Fall Asleep
This is the time when the app judged you fell asleep.
Sleep Onset Latency
Sleep Onset Latency is the length of time that it took you to fall asleep after going to bed. Generally, it takes 10-20 minutes people to fall asleep. The longer this time is, it means the longer it took to fall asleep.
Hours of Wakefulness
This is the total time of range (red bands on the sensor graph) that was judged to be awake after you fell asleep.
Awakenings
This is the number of times you woke up at night after you fell asleep.
Total Body Movements
This is the amount of body movement during sleep. This number goes up when there are many movements such as rolling over.
Until You Turn Alarm Off
This is the length of time from when the alarm goes off until you stop logging your sleep.
Alarm
This is the time the alarm went off. It will not be shown if you stopped logging before the alarm goes off.
Snooze
This shows the number of times you used snooze before you stop logging.
Sleep Evaluation
Sleep Evaluation will be shown by swiping at the bottom of the screen. If you get the higher score number, you had a good sleep.
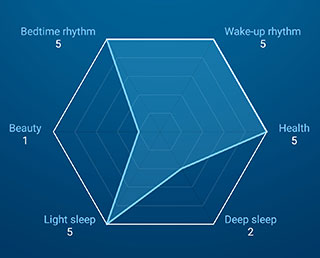
Bedtime Rhythm
This is an evaluation of the gap between the current bedtime and the average bedtime in the past month. If you regularly go to bed, you will get the higher score.
Wake Up Rhythm
This is an evaluation of the gap between the current wake-up time and the average wake-up time in the past month. If you regularly wake up, you will get the higher score.
Beauty
If the percentage of time that is judged to be deep sleep within 3 hours from the bedtime is higher, you will get the higher score.
Health
This is an evaluation whether you are oversleeping or lack of sleep. The standard sleep hours is 7 hours in this app. If the difference between the actual sleep hours and the standard sleep hours are large, the score will be low.
Light Sleep
This is an evaluation whether you have enough light sleep to rest your body or not. Regardless of the sensor graph result, if your sleep is less than the standard sleep hours, the score will be low.
Deep Sleep
This is an evaluation whether you have enough deep sleep to rest your brain or not. Regardless of the sensor graph result, if your sleep is less than the standard sleep hours, the score will be low.
Results: Snoring
Here is the brief results of your snoring. Tap “Details” to view more information about your snoring.
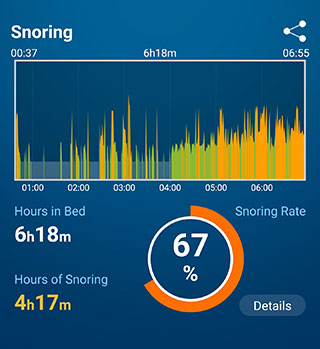
Snore Graph
This graph shows the sound volume of snoring. The current version of the app judges the snoring sound with a certain level of volume and duration. The green graph shows quiet volume, the yellow means medium volume and the orange indicates loud volume.
Hours in Bed
This is the length of time from when you go to bed (start the log) until you wake up (end the log).
Hours of Snoring
This is the total length of time judged to be over the quiet volume level.
Snoring Rate
This is the proportion of “Hours of Snoring” to “Hours in Bed”.
Details: Snoring
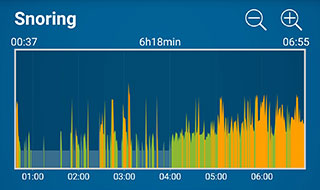
Zoom in/out icons
You can enlarge or reduce the horizontal axis of the snoring graph.
Snoring Graph
By tapping inside the graph, the tapped part of recorded data will be selected and display it on the waveform graph.
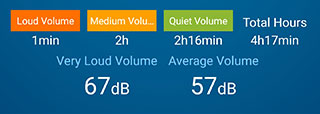
Loud volume, Medium volume & Quiet volume
This shows the length of time that the volume was respectively determined to be loud, medium and quiet in snoring.
Total Hours
This is the total hours of loud, medium and quiet volumes of snoring.
Very Loud Volume
This is the loudest snoring volume (dB) in the recording.
Average Volume
This is the average volume (dB) from quiet volume to loud volume.
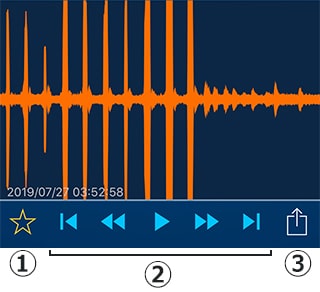
Waveform Graph
This shows the waveform of the recording data selected in the snore graph. The length of 1 recorded data is 1 minute.
① Favorite Button【Premium】
You can add the selected recorded data to Favorites. The recorded data added in Favorites will not be automatically deleted. You can check the data added to Favorites on “Favorites” in General settings.
This feature is available in Premium version. In the premium version, you can add up to 100 Favorites, the added data is safely stored in the cloud service. You can transfer the data when changing devices.
② Audio Controller【Premium】
You can Play, Stop, Rewind, and Fast forward the recorded data. This feature is available in Premium version.
③ Export【Premium】
You can export the selected recording data to iCloud. This feature is available in Premium version.
Old data will be automatically deleted
You can keep the latest 5 snoring data (if you use JUKUSUI every day, you can keep the last 5 days of snoring data) and the older data will be automatically deleted. However, the data in Favorites will not be deleted.
You can change the period to save the data in Favorites in "Record Storage Period".
Sound Volume (dB)
The general guideline for noise type and volume is as follows:
・30dB: The suburban middle of the night, Whisper
・40dB: Library in the city, Daytime in a quiet residential area
・50dB: In quiet office air conditioner
・60dB: Quiet car, Normal conversation
・70dB: Noisy street, Noisy office
・80dB: The inside of car, The inside of subway train
JUKUSUI convert the sound pressure of the signal input by microphones into volume (dB). The properties are different from “sound level meter” hardware that considers the frequency of a sounding source, please see it as a guide.
Sleep Notes
You can add a short text in the sleep log. You can add multiple notes, which can be used for Sleep Notes Analysis and also for reviewing your sleep log.
Add a note【Premium】
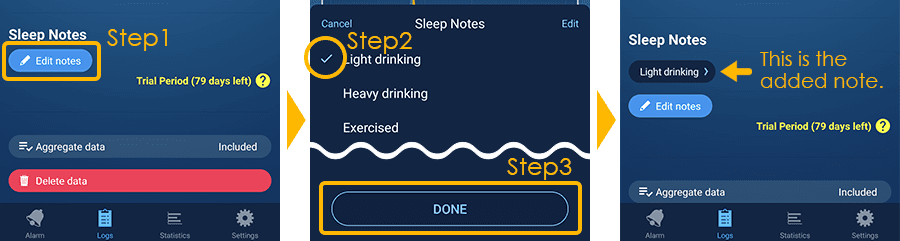
- Tap the "Edit notes" button to open the list of options.
- Tap to check the note you want to add.
- Tap the [Done] button to add the checked note to the sleep log. Tap the added note to show Sleep Notes Analysis with that note as the target of analysis.
To delete the added note, remove the check mark in step 2 above and tap [Done].
Edit Notes List【Premium】
Tap the [Edit] button at the top right of Sleep Notes input list to edit (add, delete, or reorder) the input list.
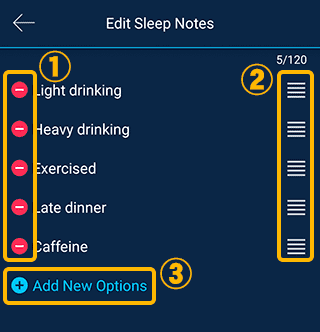
① Delete a note from the input list.
② Press and drag the four-lines mark up and down to change the order of the notes.
③ Add a new note. You can add a preset note or add a note manually.
Caution
If you delete a note that has already been added in the sleep log, the note will be deleted from the input list and all notes will be removed from the sleep logs. Please do not delete notes you want to keep in your sleep log from the input list.
Others
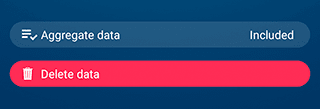
Aggregate data
Tap the button to switch between "Included" and "Excluded". The default setting is "Included". If you switch to "Excluded," the sleep log will be excluded from aggregating data in the app.
For example, if you have a nap sleep log, it will most likely deviate from your normal (nighttime) sleep rhythm, which will have a significant impact on the statistical data and make it difficult to know your normal sleep statistics. In such cases, replacing the nap sleep logs with "excluded" from data aggregation will ensure that only normal sleep logs are reflected in the statistics and analysis.
Delete data
You can delete a sleep log.