Header

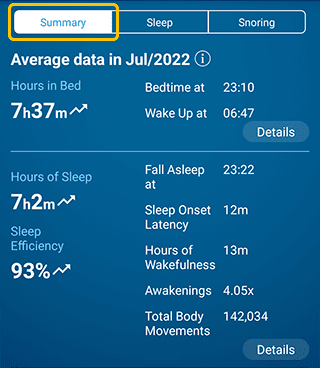
① is the target month for statistics. Use the [<] [>] buttons to move to the previous or next month.
Tap ② to show the analysis screen. The number on the button indicates the latest amount of sleep debt (minutes).
Tap ③ to show the sleep notes analysis screen.
[Sleep] [Snoring] tabs
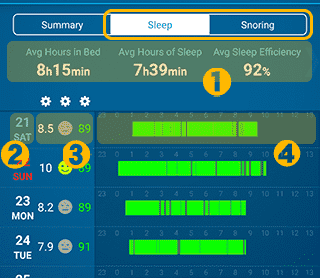
The Sleep and Snoring tabs include the following information:

① Average data
The average data of sleep and snoring logs are shown. Swipe left or right to switch the items shown on this page.
② Date
This is the date you ended the log.
③ Record Summary
Show some of the recorded data in three frames. Tap the frame to show the currently selected data type. By default, the following contents are displayed.
Sleep tab: From left to right, are "Hours in Bed," "Feeling on awakening," and "Sleep Efficiency".
Snoring tab: from left to right, are "Hours in Bed," "Feeling on awakening," and "Snoring Rate".
By tapping the gear icon at the top, you can change the type of data displayed or hide it (selectable data types are different between the Sleep and Snoring tabs).
④ Calendar list
For a date with a log, a graph from bedtime to wake-up time will be shown. When the "Sleep" tab is selected, the dark areas of the graph indicate awakenings. When the "Snoring" tab is selected, the colors of the graph indicate quiet, medium and loud volumes of your snoring.
By tapping on the list, you can do the followings:
Tap the list with data: The log of the date will be shown on the record screen.
Tap the No Data list: You can manually add the log for that date or change it to "No Sleep".
Summary Tab

The summary page shows the monthly statistical data. You can compare the data with the last month and check your trends in sleep rhythm, hours of sleep and snoring, etc. You can also see how your sleep has changed when you take some action to improve your sleep.
For information about this screen description, check here.
